The EmTech for Life Long Learning and Success MOOC is a course through SUNY and run on Coursera that encourages people to stay involved with emerging technology as it has great importance in any field. The purpose of this blog post is to help my ePortfolio meet the requirements for the ePortfolio Badge that can be earned through the completion of the course without me needing to rearrange my entire website.
Module 1: Lifelong Learning
Welcome to my website! I already have an established ePortfolio (feel free to explore!), so I created this blog post to track the requirements for the course. Please see the “About” tab for more information on me.
For Module 1 I decided to explore the tool Notability. I used this tool in the past for notetaking, though I took this opportunity to explore the tool a little further and look into other ways it could be used to help me. I’m a very visual learner and enjoy seeing graphics to help represent the things I’ve done, so I created a chart to show my progress through both my education and my work thus far. The images below represent the chart (though they will be a little hard to read, given how small the images are!)
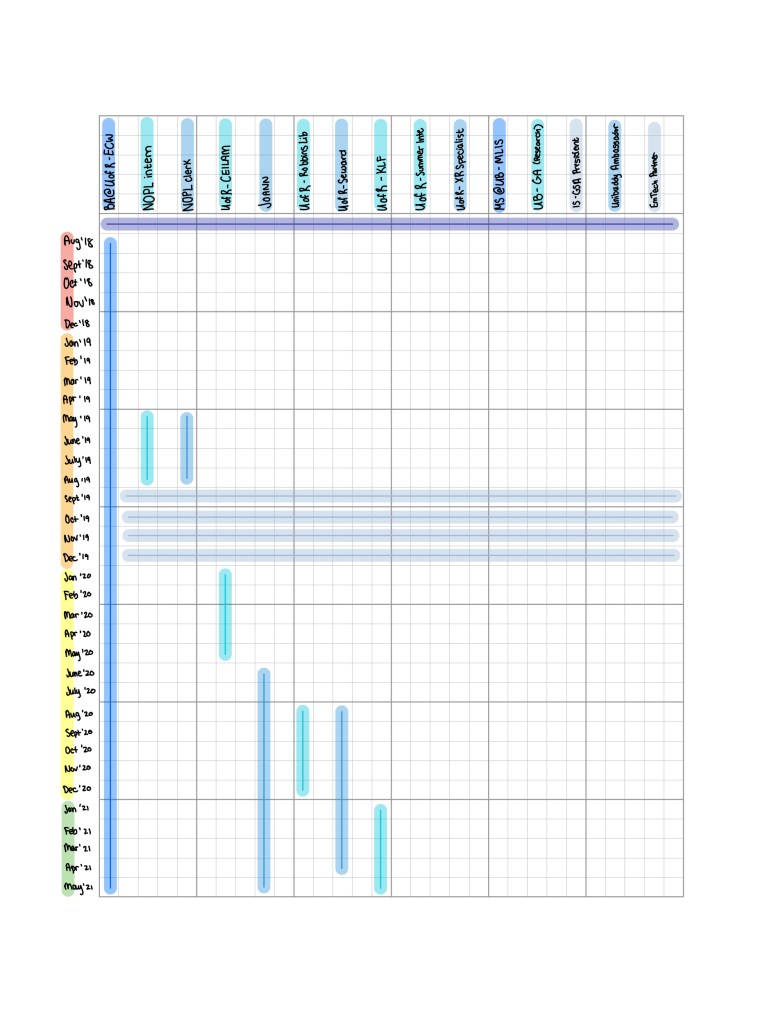
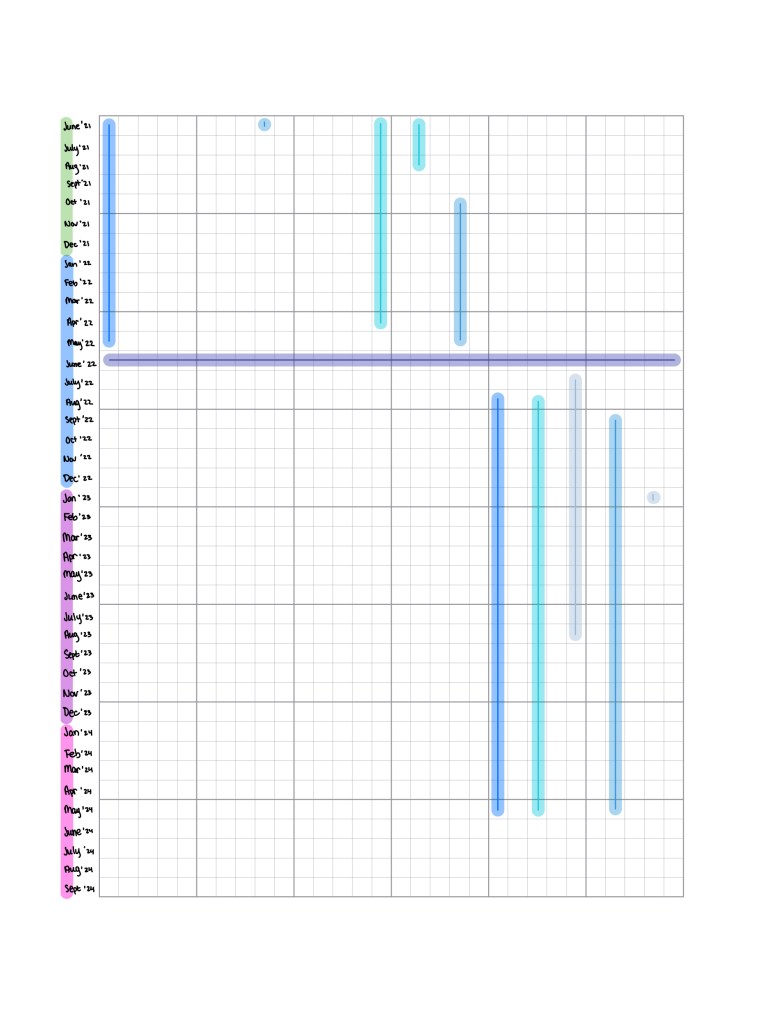
I believe that during my exploration of this tool, I see that it has many applications beyond notetaking that will benefit me in the future. Not only did I discover the range of highlighter colors (I didn’t realise there was more than one page of them before) but I also discovered that you could format the page in a graph format, which will be useful for any future graphics I make. I will note that this app is only available on Apple products, which does limit the accessibility of it, but for those who do have this line of product, I recommend you try it out!
Module 2: Communication and Collaboration
For this activity, I chose the AllTrails website/application. AllTrails is a resource to help community members find places to walk, hike, and more in their local area, as well as to help people plan out future trips to different destinations. This application was rather interesting to me as I am planning to visit Acadia National Park in the summer with my family.
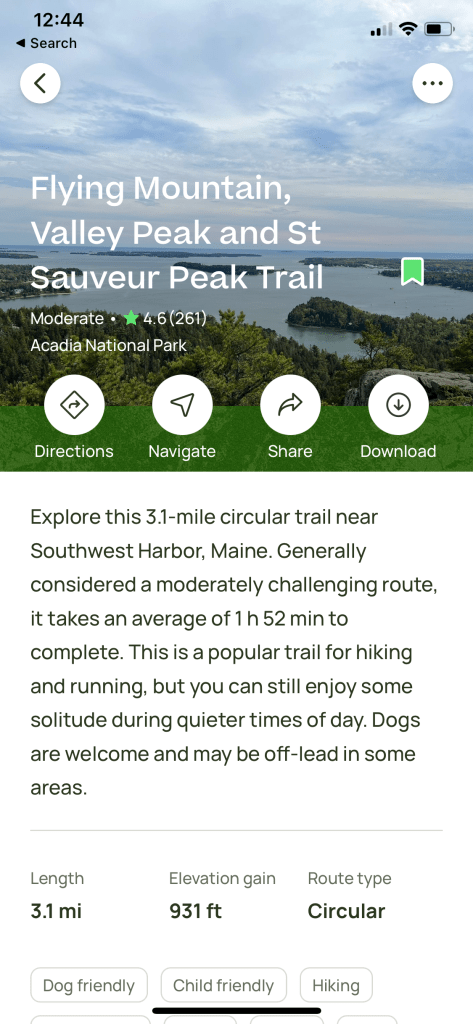
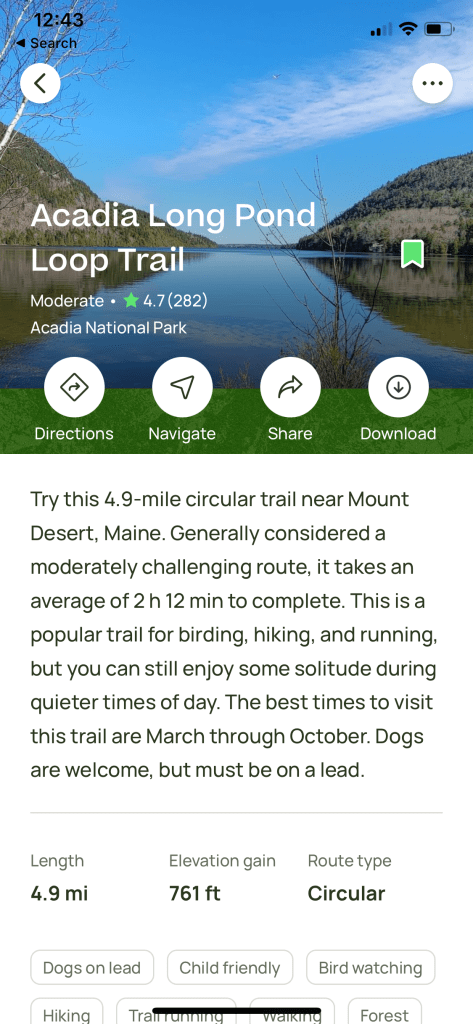

As I will be bringing my puppy with me (and my parents will have their dogs as well) I was really excited to see that the app (I was using it on iPhone) has the option to select dog-friendly trails as a filter for searching. Above are images of two of the trails I added to my list, as well as a sample of some of the filter options you have when searching on the app. I think that this tool will be useful to me when we arrive, as it also has detailed maps of the walks to help you navigate the trails that have multiple path options. My favorite feature is the photos that users can add to the trail posts, as this also helps me plan out which walks I will want to bring my camera on!
Module 3: Creativity
For this activity, I chose to look for something that would help me visualize data in a creative way. When searching the Em Tech wiki, I found Infogram. Infogram is a site that allows you to create unique infographics for visualizing data. Below is an image of the infographic I created.
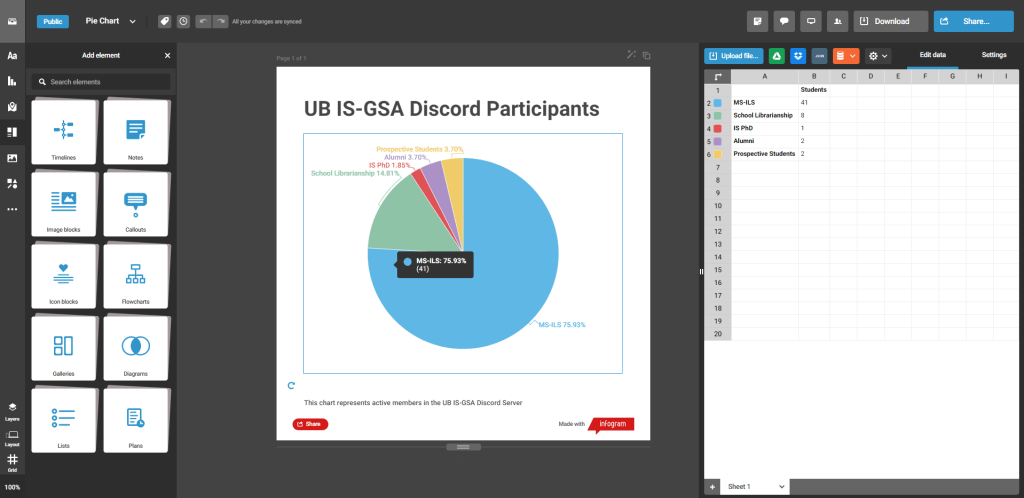
Unfortunately, with the free version of the application, you cannot download the things you create, so I instead took a screenshot of the application as a whole. While the inability to download is a little frustrating, and would be a setback if I needed this diagram for a presentation, the screengrab allows me to show you a little more about how the page works. You are able to choose the way in which you want to represent your information from a plethora of options (to the left) and you can either type out your data or import it to the site (on the right).
I chose to make a little chart to visualize the area of study of the active members in the University at Buffalo Information Science Graduate Student Association that I am president of. This information helps me to determine ways I can best serve my organization, and it was really interesting to see what people are studying! (This data doesn’t represent every student, as the roles for the area of study are self-assigned. Not everyone in the server has reacted to a role, so about half of the server is not represented here).
Module 4: Critical Thinking
For this activity, I chose to look for a site that would assist me with future classes, as that’s where I do he majority of my critical thinking. With this in mind, I chose to explore the Directory of Open Access Journals (DOAJ). This community-run website provides a catalog of open-access journals, making it easier for users to search for free-to-read articles. Below is an example of what the DOAJ site looks like after you have found an article you’d like to read.

This site is extremely useful, and I wish I had known about it in my first semester of graduate school, as it would have been extremely useful for finding articles for my research papers! It functions just as a regular online catalog would and provides a lot of information about the articles, so you know exactly what you will be getting if you decide to proceed off-site. This is a fantastic resource that I’m excited to share with others.
Reflection
When I set out to complete this course, I didn’t know where to set my expectations, but I must say that I was pleasantly surprised with the course as a whole. Working through the course had me thinking about a wide variety of topics and introduced me to new resources I wasn’t familiar with before the start of the course. This program has motivated me to continue to pursue my lifelong learning goals by showing me the importance of staying current with technology trends. I believe that everyone can benefit from taking this course, and I will be sure to recommend it to my peers, as future librarians should be staying up-to-date on emerging technologies as best they can!

Leave a comment